Email:
sales@dewetron.com.cn
Whatever is required should be possible
DEWETRON Mixed Signal Recorders offer portable, battery powered or stationary data acquisition platforms in multiple form factors and performance classes, direct connection to sensors, and powerful and easy-to-use software.
Key features:
n Any sensor any type (analog, digital, serial, ...)
n Multiple rugged and scalable housings
n AC, DC or battery power for mobile applications
n Extendable with CAN-bus data, ARINC, GPS values, and video from one or more cameras
n ADC with 16, 22 or 24-bit resolution
n Powerful filter and trigger functions
n All recorded in a synchronized way
n Recording for hours, days or weeks
Fastest time to highest quality test and measurement result
n Online monitoring and data analysis
n Own set-ups or predefined configurations
n Sensor database
n Easy traceable single shot or long time recordings
n Offline report generation with standardized or individual reports
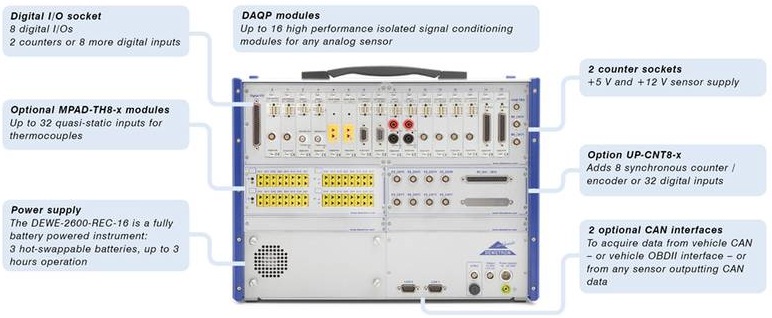
Functional overview of a typical recording instrument (DEWE-2600)
Visualization
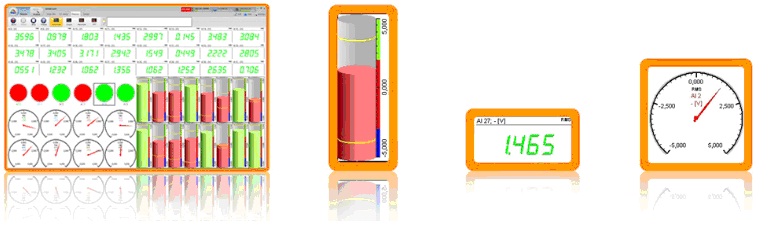
Digital & analog meter Bar graph Digital meter Analog meter
Different colours for Data is represented as actual Data is represented as
different ranges possible. value, RMS or averaged. actual value, RMS or
Time window for calculation is averaged.
selectable.
Graphs
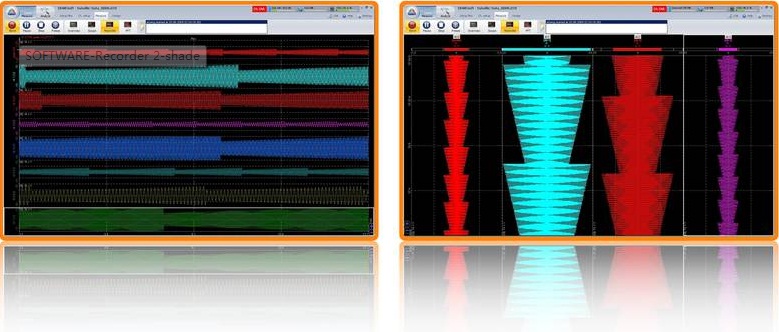
Recorder graph Vertical recorder
Shows up to 32 channels per screen - the total number of Recorder graph, in vertical "paper recorder style".
channels can be 1.000 or even more.The data is streamed Additional information of the absolute min and max values
to the local hard disk at a rate of 160 MB per second (i.e. 80 of each channel.
channel @ 1 MS/s).
The recording time can be minutes, hours or even days and
is limited by the hard disk capacity only. Multiple time axes
allow to visualize data in great detail but also give a voerview
of a hours at the same time.
While continuously streaming data the screen can be
switched to FREEZE mode - details of the last seconds can
be viewed and analyzed while stroing in the background.
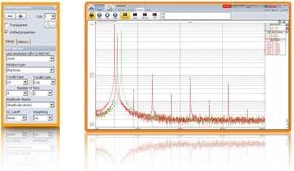
FFT Analyzer
|
Real time FFT This view is used to display a real time FFT diagram, based and calculated from each channel which is captured. Even amathematical channel can be used.
Select line resolution, window type and lin or log scaling for both axes. Display modes like averaging, overlapping or weighted. Data is calculated and displayed while storing. All harmonic life peak values can be displayed in a separate table. |
|
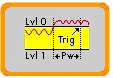
Scope mode / trigger
Scope mode
Allows to set FREE RUN, NORM and SINGLE SHOT mode.
Trigger function
Press STORE and then STOP to control recording, or versatile TRIGGER types.
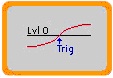
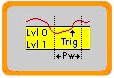
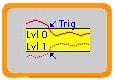
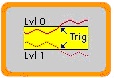
Simple Edge Trigger Window Trigger Pulsewidth trigger Windows and pulsewidth Slope trigger
Multiple trigger
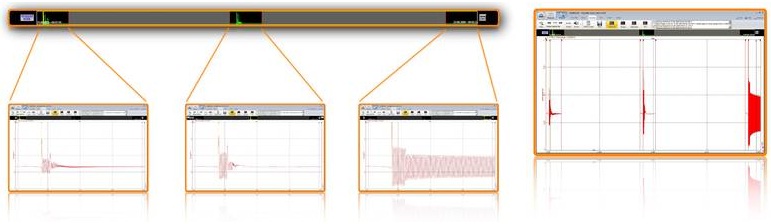
Dependent on the defined trigger conditions data is only stored, when one or more of the conditions are true. By defining pre and post trigger times also data before and after the condition case is captured.
Since no data is stored between trigger conditions the amount of stored data is minimized. In the ANALYZE mode each trigger window can be shown separately. Measurement cursors for absolute values, time or frequency. Pre and post data analysis of events is possible.
Data processing
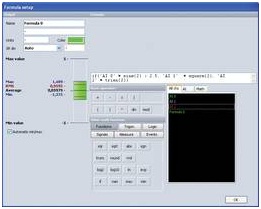

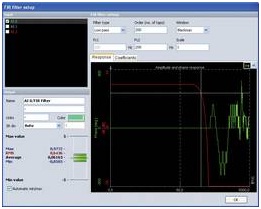
Math formulas Statistical calculation Filters
All major arithmetic, logic, algebra and Statistic like average, RMS, QRMS, Different types of filters: IIR filters like
measure functions can be combined with Minimum, Maximum, Crest, Peak, Chebyshev, Butterworth and Bessel. These
any measured or calculated channel to Peak-Peak, Variance and standard filters allow also single and double
create sophisticated formulas. deviation can be calculated in specific differentiation and integration.
time intervals, as a single value or FIR filters are even smarter. When signals
based on events. are filtered, filter introduces a phase shift,
so the output is delayed compared with
input. DEWESoft FIR filter filters data without
any phase shift or delay, so it is perfect for
analysis of signals which does not alow
having phase shifting or delaying.
![]()
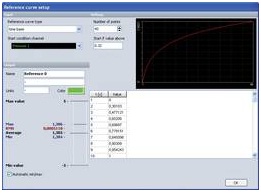
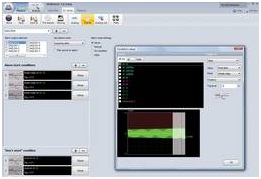
Reference curve Exact frequency Alarm output
For comparing the data with predicted curve This quite smart module can calculate All the measured and
or with previously measured data DEWESoft frequency from a sine wave with precision calculated channels can be
offers modules to create time, FFT or x-y of 1 mHz even if the input sampling rate is as the trigger conditions for
based reference curves and use that as a not very high. digital output.The trigger criteria
limit criteria. can be virtually anything:simple
edge, filtered edge, window,
pulsewidth, slope...
The event can be set to
visual component on display,
a sound can be played or we
can use AD card to output
alarm to external digital line.
Storing
Streaming
With a very specific data file structure we can write the channel setup, display setup, all the events, fast analog data and slow asynchronous data from different sources in a single file. For long term measurement DEWESoft offers to switch the file automatically when certain file size is reached or after specified time (e.g. 24 hours). The file switches in that way that no data is lost in between.
Triggered storing
Quite often the system needs to watch the data for several days or weeks, looking only for very specific events. It is not nice to store all the data to the hard drive and then search for that event. Therefore DEWESoft offers very extensive triggering – we can use start and stop triggers and use pre and post time for triggering.
The trigger conditions can be:
n Simple edge (either rising or falling slope)
n Filtered edge (edge plus rearm level; either slope)
n Window trigger (two levels; entering or leaving logic)
n Pulsewidth trigger (longer or shorter than duration logic)
n Window and Pulsewidth (completely selectable as above)
n Slope Trigger (either rising or falling slope with steepness selection)
We can also use math formula to create combined trigger conditions. There is also an option to store fast data on triggers, but store reduced data (min, max, average and RMS values) for the time when triggers are not active. This gives a rough idea of measurement values when triggering was not active.
Database storing
For applications which requires long term storage and off line post processing, DEWESoft offers a database storage where the data is packed and sent to remote database server. The slow speed data is stored all the time and in case of events a full speed data is acquired and stored. Database storage is mainly used for distributed applications.